
MOMENT-TO-MOMENT TESTING
Moment-To-Moment testing has easily become one of the most powerful and popular features of our Audience Response System. It gives the user the ability to test video and audio material on a second-by-second basis. We take the resulting moving line graph and superimpose it over the test material producing what we call an “overlay.”
The Moment-to-Moment test results are delivered in a convenient digital format. The graphs are easy to read and the perfect way to present your test results. Introductory graphics with your logo, your client’s logo, graphics that describe the project and each individual Moment-to-Moment test, and professionally produced labels are included with each digital file.
HERE ARE THREE EXAMPLES OF ACTUAL DATA SCREENS:
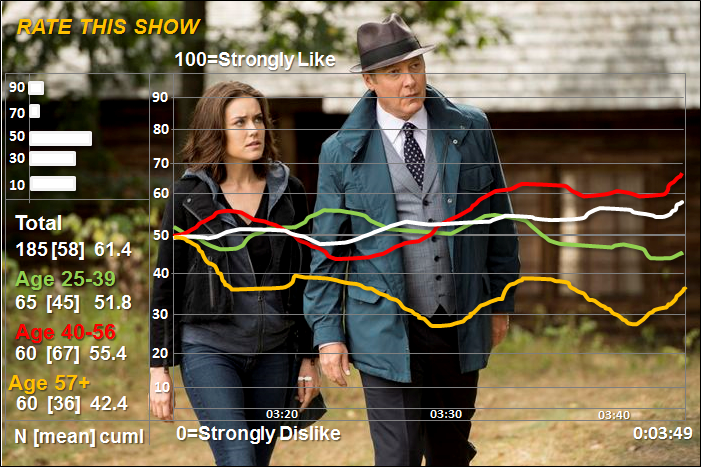
Moment-To-Moment: As the respondent views the test material – advertisement, program, speech, presentation, etc. – they rate what they are seeing by turning the dial up for a positive response and down for negative. The resulting animated line graph shows the results at each second broken down by the selected subsets. The N, the cumulative mean, and the current mean scores are shown along with a histogram showing where the dials are turned to at each particular moment. Moment-To-Moment tests can be from 10 seconds to more than 2 hours.
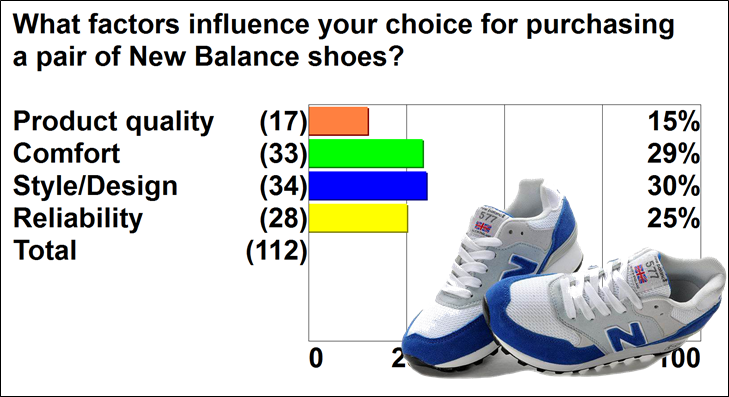
Discrete Choice – or Categorical – A question that forces the respondent to make a choice from a list of possible answers. Essentially, it’s a multiple choice question. Most demographic questions are Discrete Choice. For example, the respondent is asked to pick their gender with, of course, their only choices being male or female. Other examples could be questions about education, income, marital status, race, number of children and political ideology. The resulting bar graph shows the percentage of answers for each category. These responses are also used so that the responses to Scale and Moment-To-Moment questions can be broken down into subsets, such as gender and age.
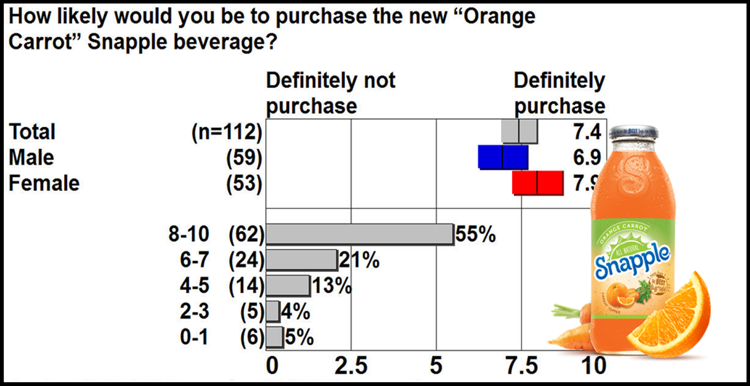
Scale Question gives the respondent the opportunity to answer a question on a “0” to “100” or “0” to “10” scale. With 50 (or 5) being the neutral point, typically the closer to 100 the stronger the positive response and the closer to 0 the stronger the negative response. The respondent is allowed to dial anywhere on the “0” to “100” scale. The resulting bar graph shows the average readings of the total and the selected subsets. The width of each bar indicates the 95% confidence level. In addition, a histogram can be shown.